Data holds valuable insight into organizational productivity, customer habits, and proactive decision making.
Unfortunately, most businesses fail to recognize their operational data as their most valued asset simply because it doesn’t appear directly on any financial statements.
As a result, business leaders often fall short of utilizing their data to the fullest potential.
In this Q&A Odyssey Information Services‘ Greg Hunt, an experienced Solutions and Data Architect with an emphasis on database performance and design, you’ll discover:
- Barriers impeding opportunities
- How proper data management practices can reduce IT overhead
- Techniques, tips, and methodologies used to provide greater insight into an organization’s database performance
- Real-world examples of helping businesses correct their database issues
- Best practices to improve your database’s efficiency and accuracy
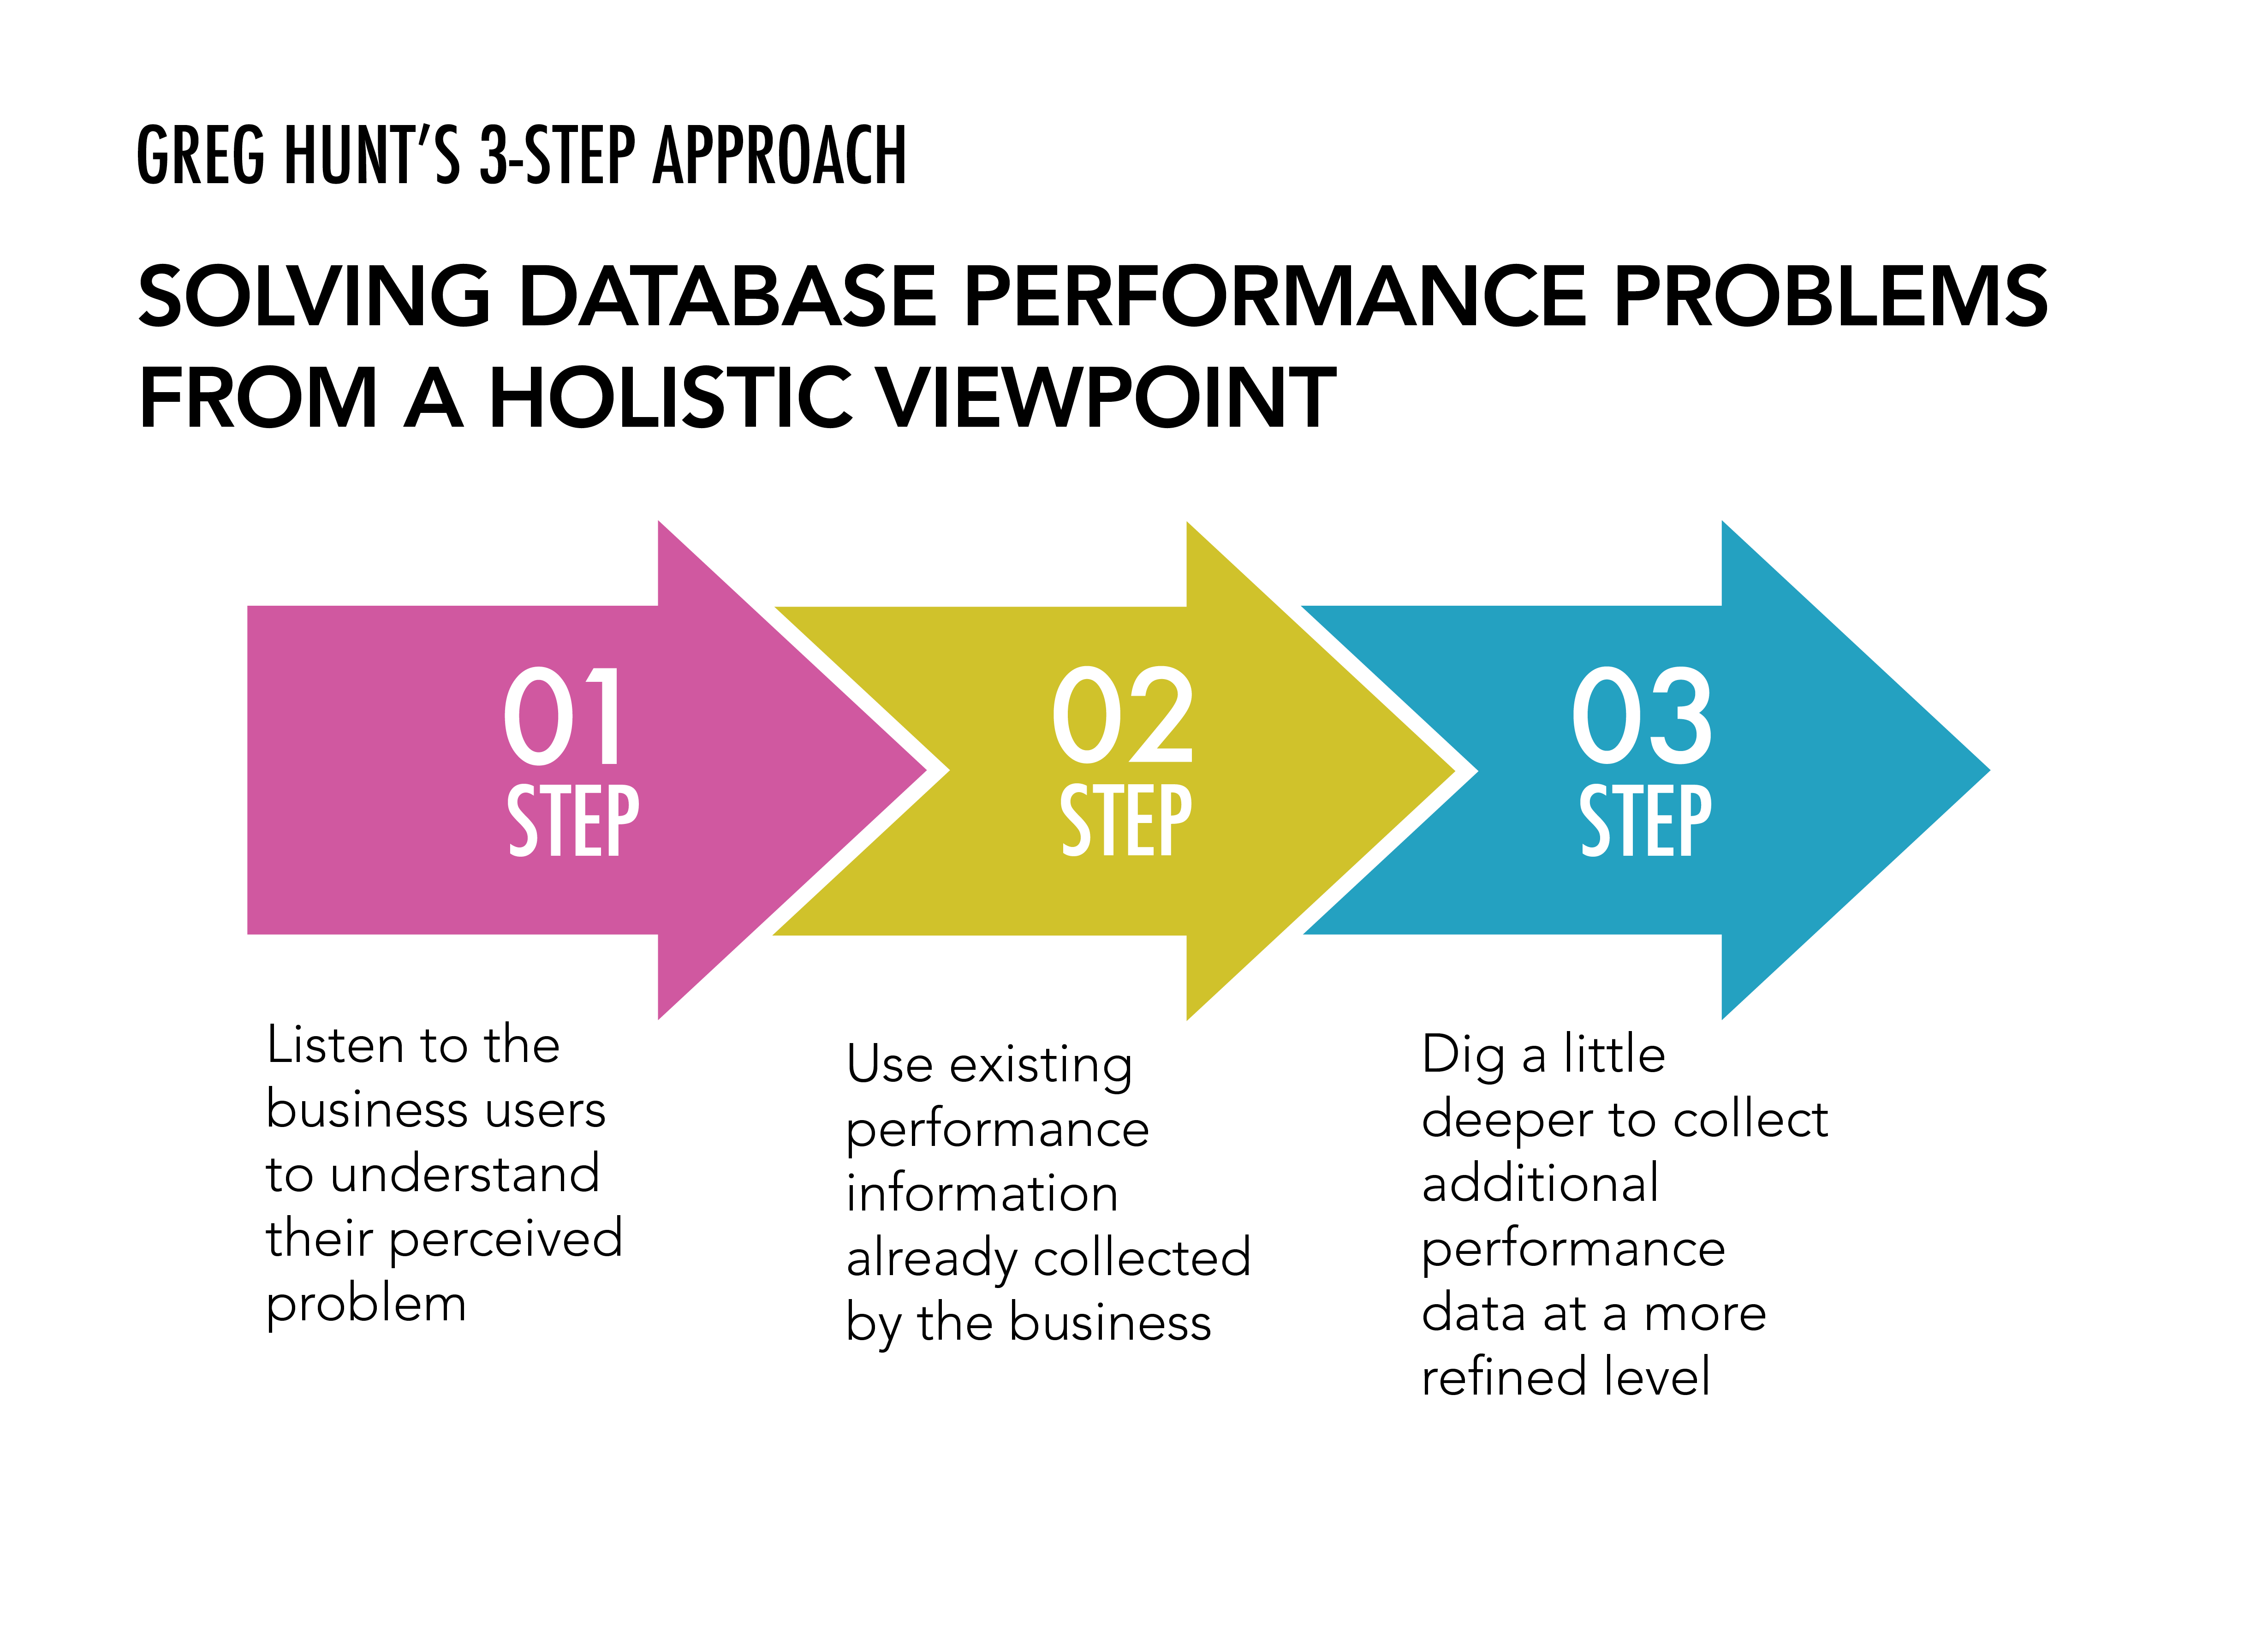
As a Data Architect, how do you help organizations improve their database performance?
Organizations typically bring me on board when they know their database isn’t performing like it should. Often, they realize their staff does not have the capabilities to address the problem(s) and seek outside assistance.
As a Solutions and Data Architect, I bring a fresh set of eyes, a diverse career background, and an independent approach to the challenges the client is facing. An additional part of my role is to act as a mentor and teacher.
My primary mission is to always isolate the problem, identify a solution, recommend an implementation plan (whether I’m part of that implementation is up to the client), and transfer basic knowledge to the organization’s staff.
Every company is collecting data today, but few are using it efficiently and to its fullest potential. With my assistance, I can guide their efforts of turning data into actionable information.

How do you view or approach a situation differently than someone whose primary responsibility is programming or developing?
Oftentimes, it takes years to learn and refine skills within a selected career path. Therefore, if a programmer is looking into a problem, they will do so with the lens of a developer. Likewise, a system engineer will attack the problem from the systems point of view. A data architect, however, will look at it from a data perspective. I consider myself fortunate to have such a varied career background, thus allowing me to view problems from multi-disciplined perspective versus that of a single work experience.
Here’s an example of how I took a step back to see the bigger picture. I worked with a healthcare client who was concerned about 25% of their transactions running longer than all the others. They said these slow transactions appeared to be random and they were unable to identify anything specific causing this condition. As it turned out, it wasn’t random at all. The Systems Engineering group didn’t understand the application and found nothing abnormal in their system performance monitoring. The Application Development staff were unaware of hardware upgrades that had recently taken place. Because there was no history of this abnormal behavior, nobody knew where to look for the problem. What I discovered was a mixture of CPU types in the same physical machine. It turned out the “slow transactions” were taking the same amount of time as they had prior to the CPU upgrade. However, transactions running in the newer CPU types were now faster than before—thus, leading to confusion between the groups.
That is an excellent example of how I listened to all the departments, stepped back from the problem, and asked questions neither group thought to ask. Understanding of the entire IT environment was critical to discovering the source of this problem.
What are the most common problems you encounter?
What I’ve learned over the years is that all companies, big and small, make the same kinds of mistakes. Below is a list of the more common situations I encounter.
Problem No. 1: Cutting corners
Rushing to meet a deadline and cutting corners rather than taking a little extra time to get the design right the first time is the single biggest issue I repeatedly encounter. Application, database, and query design—they are all equally impacted when you rush through development. Cutting corners usually results in unhappy end-users, poorly performing applications, failure to meet business requirements, over- and/or under-utilized system resources, and poor or delayed business decisions.
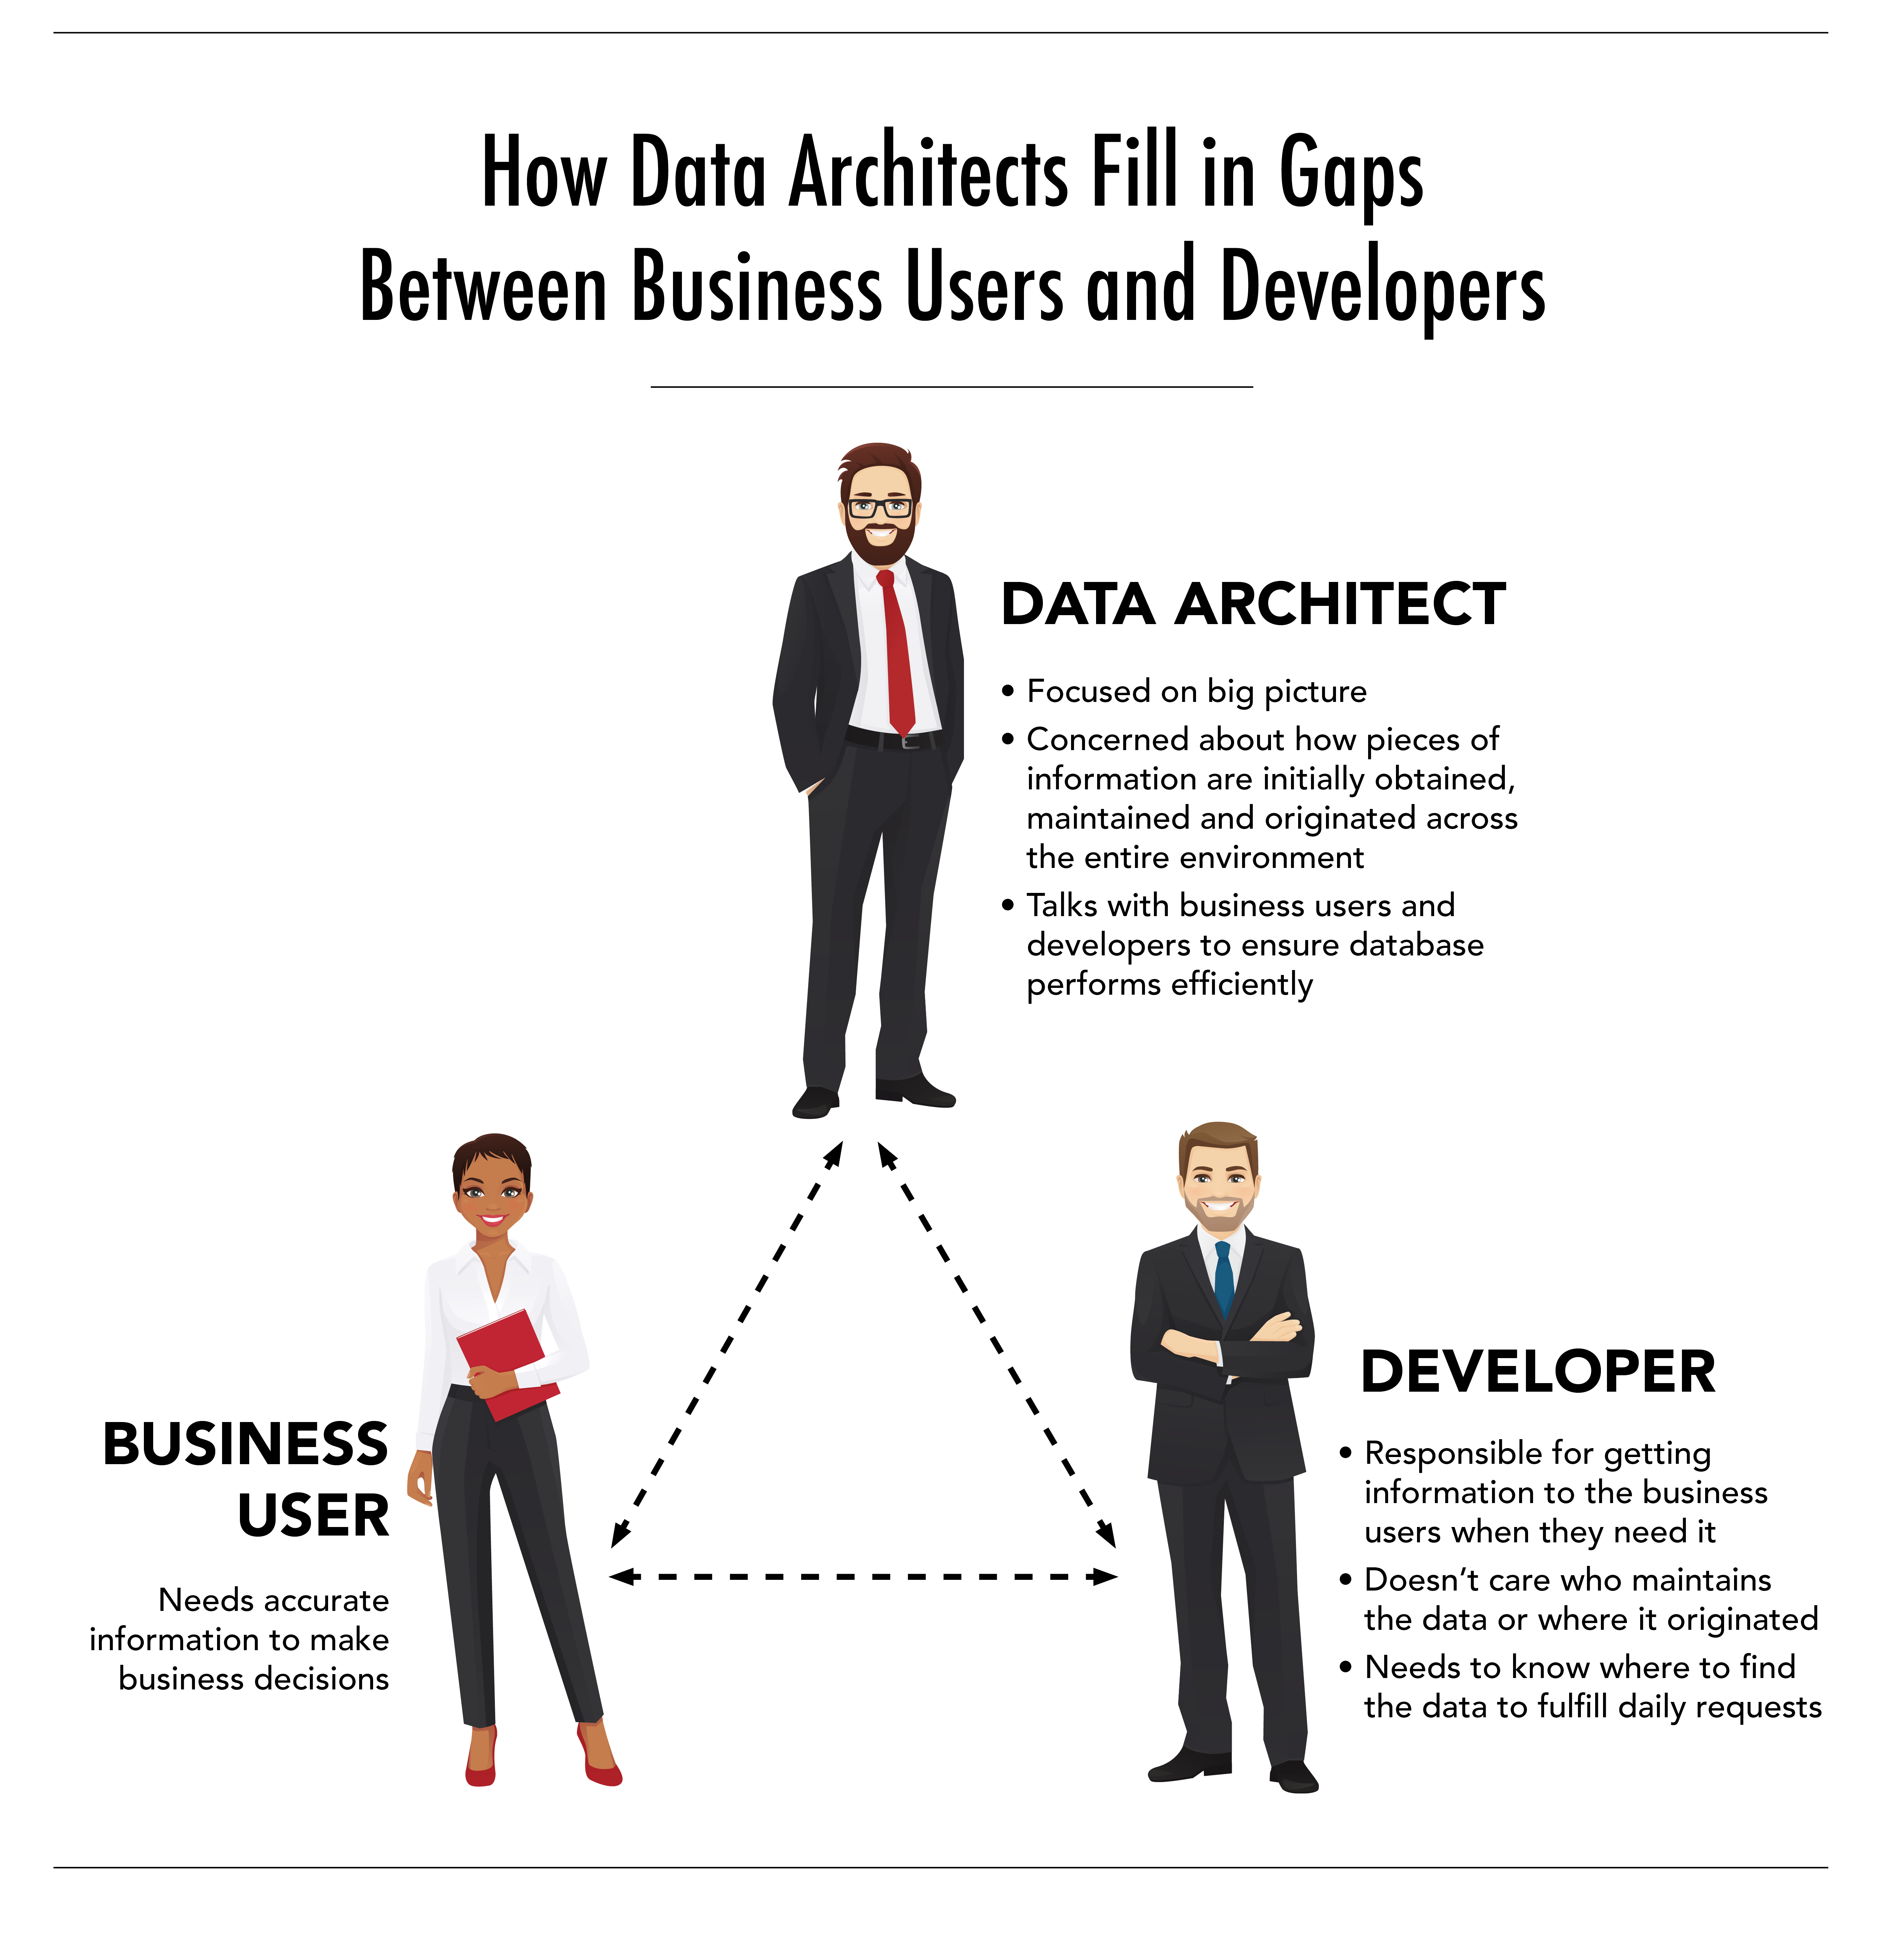
Problem No. 2: Communication breakdown between developers and business users
I see this problem frequently. IT and the Business do NOT speak the same language. This failure to communicate leads to misunderstandings and incorrect interpretation of requirements. Far too often, I see development teams saying, “We know best how the business operates” or “what they are asking is unrealistic, we’ll do it this way.” Companies need to develop individuals who can bridge this communication gap to avoid future problems.
Problem No. 3: Not understanding the data source
In today’s business environment, data is literally everywhere. Knowing the source of data and understanding how and what it represents are essential to integrating this information into an existing data set. Not only is it important to understand the contents of a data source, but it is equally important to understand the availability of this information to establish and/or meet business service level agreements (SLAs).
I had a client one time that was collecting sales data that included a loyalty card ID. Because of limitations on the upstream system, loyalty card information was stored as character data rather than numeric. They carried this data type into their production environment and immediately encountered issues from the non-numeric data in the loyalty card ID. This situation caused several problems to occur including application failures, inaccurate data reported to the user, and poor business decisions from using bad data. The developer’s solution, in the query that processes loyalty card IDs, was to code their SQL statement to check each character to ensure it was in fact a number each time this data was accessed before it could be married with data from other sources.
What they should have done:
- Cleansed and validated data during the onboarding process
- Used proper data types
- Integrated data with other business data
Implementing the above items would have resulted in a single validation at the time of data acquisition versus validating the loyalty card ID each time it was utilized, and it would have eliminated unnecessary and excessive system resources that could be used for other processing.
Problem No. 4: Special consideration is not given to hardware or operating system features and functions
It is always desirable to utilize both hardware and software features and functions unique to that platform to maximize performance. Companies don’t always have the personnel with the right platform, DBMS experience, or training to exploit maximum performance.
One of my clients had been using an IBM DBA to support their NonStop platform prior to his retirement. His experience and technical training did not afford him the knowledge of inherent features and functions unique to the NonStop SQL engine capable of reducing application outage time. One such feature is “SIMILARITY CHECK ENABLED.” Similarity checking is a unique feature of the HPE NonStop DBMS. Therefore, most IBM personnel are unaware of it. With similarity checking enabled, queries continue to run if the underlying data continues to support the needs of the application regardless of any database changes. By not taking advantage of this capability within the platform, it created an artificial and unnecessary outage to the customer. When I became involved with this client, I recommended enabling this feature. In doing so, we were able to reduce application outages related to database changes from a minimum of two hours all the way down to 90 seconds on average—often with no perceivable impact to the end-user.
Scorecards: What are they and how do they help you perform your job?
Scorecard is a methodology used to collect, analyze, and rank user definable multi-metric performance data. This technique allows me to identify a set of objects quickly and efficiently for my initial performance analysis.
The scorecard is flexible and dynamic in that new metrics can be added and old ones removed without impacting the analysis process. Historical data can be retained to track performance over time. Like all performance analysis processes, this method is also an iterative process. This process can work equally well for database, system, application, and business performance analysis.
For database analysis, I collect the following types of data:
- Records accessed
- Records used
- Query busy time
- Query elapsed time
- Memory
- Sorts
- Sort time
For systems analysis, I typically use:
- CPU busy time
- Memory utilization
- Swaps
- CPU queue time
- Disk queue time
As a part of my database analysis, I utilize a user-defined metric that I call Access Ratio. This ratio metric is calculated by dividing “Records Accessed” by “Records Used.” Access Ratio is important because as it moves farther from 1.0, it indicates not all data being accessed is being used by the system. This measurement is an indication there could be an issue with the ordering of the Primary Key or an index being used that doesn’t address a query’s specific data needs. Tables and queries need to be reviewed to determine the appropriate remedy.
I normally use 10 metrics (seven system and three user-defined metrics) in my scorecard for an initial database review. This has proven to be successful in providing me with visibility into how the database is performing. Once data is collected and analysis begins, it’s not long before I am able to narrow down performance issues to a set of queries, a time of day, or even day of week.
Here are a few visuals that will help you better understand my scorecard process.

The table above shows which SQL statements appear in the TOP 5 by performance metric. The number in the main body is the total number of times that SQL statement had an entry in the TOP 5 for each individual metric. The blue area includes basic statistics that allow analysis over time.

The data in this table shows the TOP 20 most offensive SQL statement utilizing a Performance Metric Weighted Average. The metrics that are ranked lowest values are the most offensive. The body of the table shows individual queries over time and their relative rank during that specific measurement window. The blue section of the table again includes basic statistics utilized to target offensive queries with an emphasis on the previous three months.

The left side of this spreadsheet shows a listing of the raw Performance Metric data. The right side is a series of calculations used in the overall evaluation of the health and well-being of the environment being monitored.
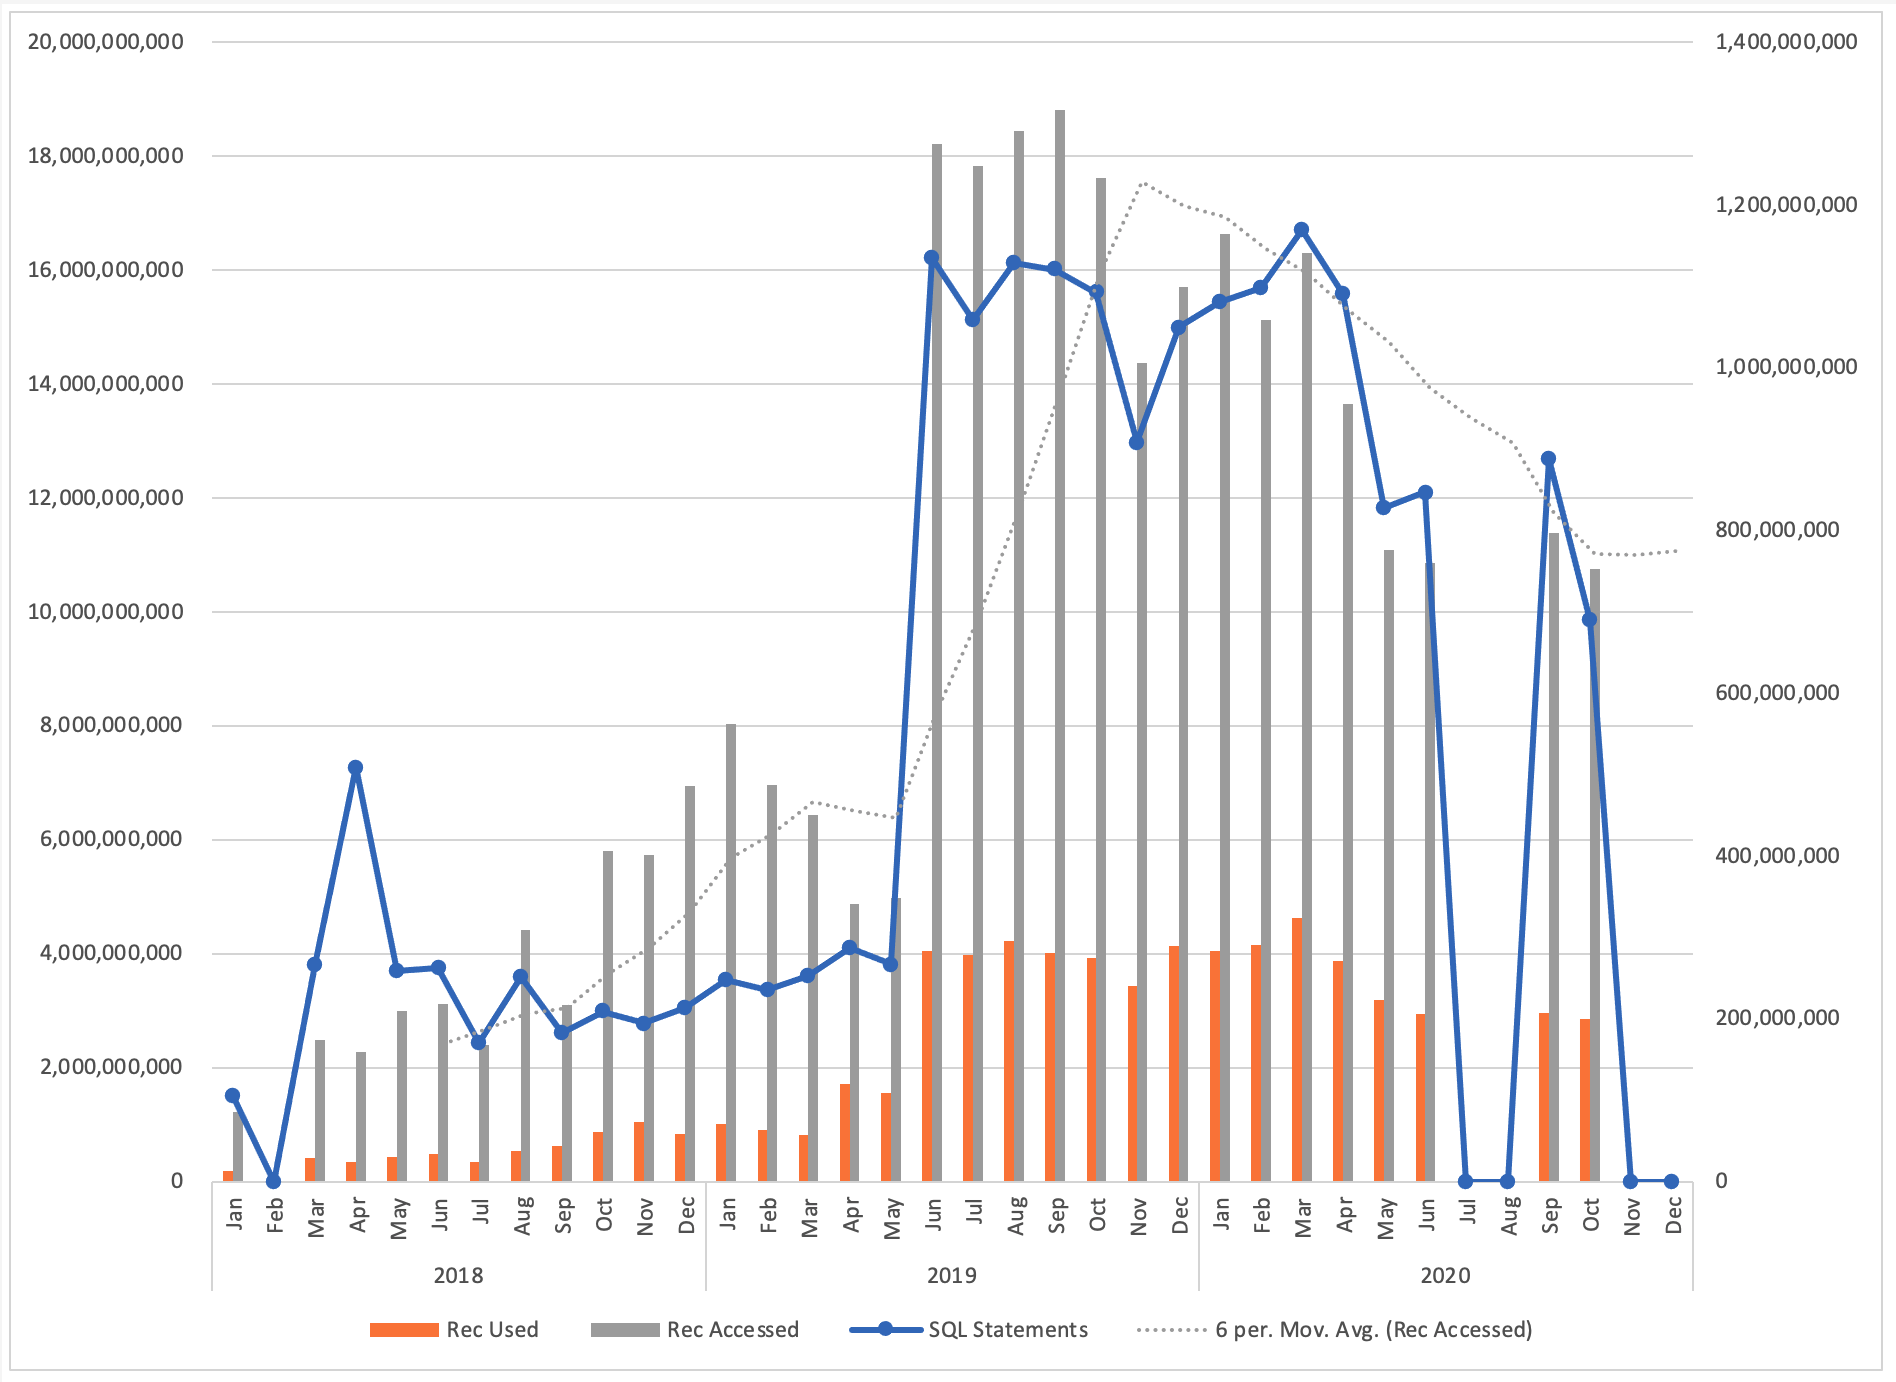
This chart was produced to allow the client to visualize overall performance and specific change impact. In this chart, the six-month trend line shows a steady decline in data access, which is the direct result of application and database changes implemented to improve query performance. The sudden upward shift between May and June 2019 is the result of a change in the collection of performance data. It went from four hours a day to 24 hours a day. Periods where NO data is reported is a result in failures to properly collect/maintain performance data.

This pivot table is the underlying data utilized in the chart below. Rarely is this data considered part of the analysis process. However, it’s maintained for historical references, trend analysis, and change management impact.

Recommendations are part of the scorecard analysis and performance review process. This table is an ongoing method for the client to review specific change recommendations and to keep an historical log of implemented changes.
One little error in a database’s design can cause big problems. Which database or query modifiers should be avoided and why?
Below is a quick list of tips I generally consider to be “Best Practices” when designing databases:
- Avoid Using Hints
- Use Proper Datatypes
- Eliminate Unnecessary Attributes within Queries
- Think about Relationships
- Keep Statistics Updated
- Avoid Table or Index Scans
- Limit Temporary Tables
- Limit the Utilization of TOP Function
- The ORDER BY Clause is Mandatory in a Query Where Sorted Data is Mandatory
- Use ‘Cover’ Indexes Where Possible
Click here to read a more in-depth explanation of Greg’s top 10 database design best practices outlined above.
Conclusion
Broadening your understanding of your company’s data—where it comes from, who uses it and the performance your users need—are keys to a successful application environment. The business environment is always changing, so it’s important to always be ready to understand how to incorporate new data into production and how it will affect all users. Think about performance every time you make a change.
Odyssey Information Services offers a wide range of database management and support services that your business keep its data safe, accurate and performing at all times.
If you’re interested in learning more about Greg Hunt’s data analysis techniques or how a data architect can help your business overcome its data challenges, reach out to Greg at Greg.Hunt@OdysseyIS.com.
About the Author


